Precedent Transactions Valuation
Precedent transactions analysis is a relative valuation method based on precedent transactions and key ratios/multiples within a sector. Common used ratios are EV/EBITDA and EV/SALES.
1. Select the universe of comparable acquisitions
To start with, you should identify transactions made in your sector. If you have difficulties finding such transactions, try to find similar transactions in sectors similar to yours – that are affected by the same external effects as your company. For example, if you are producing windows and cannot find transactions between window manufacturers, try to find transactions made between real estates manufacturers for example.
Look for transactions in your region and the same size as your company! If you run a US company, choose transactions made in the US. If you run a global company, choose world wide mergers and acquisitions.
2. Locate the necessary deal-related financial information
If you have a database such as Bloomberg, Zephyr, MergerMarket or Reuters, this step is easy. If you do not have access to these types of resources, you will have to find annual reports, make searches on google or read specific company analyses and sector reports – to gather your data. Look for SALES, EBITDA, forecasts and Deal Values.
If you have followed this step by step tutorial this far, and enjoyed it, I would very much appreciate if you could help me promote this website by clicking the google and Facebook symbols below to recommend this site to others:
[fb-like-button]
3. Spread key statistics, ratios and transaction multiples
Now analyse your peer group and calculate key multiples. Commonly used multiples are EV/EBITDA, EV/SALES, EBITDA margins and growth rates.
4. Benchmark the comparable companies
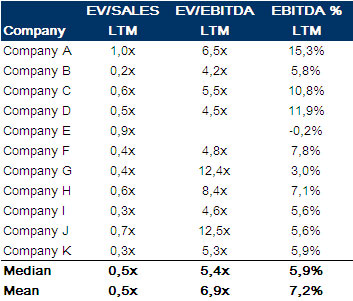
Key multiples from our example:

5. Determine valuation and output
Use the key financial numbers from the company you wish to value. For example, if your company had sales of 100 million in the last twleve months (LTM), this would imply an Enterprise Value of 50 million (0.5 x 100) in our example. If your company made an EBITDA of 10 million (LTM), this implies an Enterprise Value of 54 million (5.4x * 10 =54).
The valuation range for this company is therefore in the range: 50 – 54 million!
 I will do my best to help you quick
I will gladly help you with any question you might have. Either comment below the relevant content or send me an email or use my contact form which can be found here.
Specialities: Business valuations, Excel models, Business development, Investment Banking, Buyouts, Divestments, Share issues, IPOs, Management Buyouts, Leveraged Buyouts.
Have a great day! (thanks for sharing my website which helps my content available to more users)


There’s a typo in part 5. The last sentence “this implies an Enterprise Value of 83 million (5.4 x 54) ” should be “this implies an Enterprise Value of 54 million (5.4 x 10)”.
Thanks for the tutorial!
Thanks for reading and using the website! All input always appreciated.